Data Collection & Analysis


Before zeroing in on a particular property, I want to understand what properties are selling in that area, at what price, when they were sold and all the different sorts of data that you can imagine.
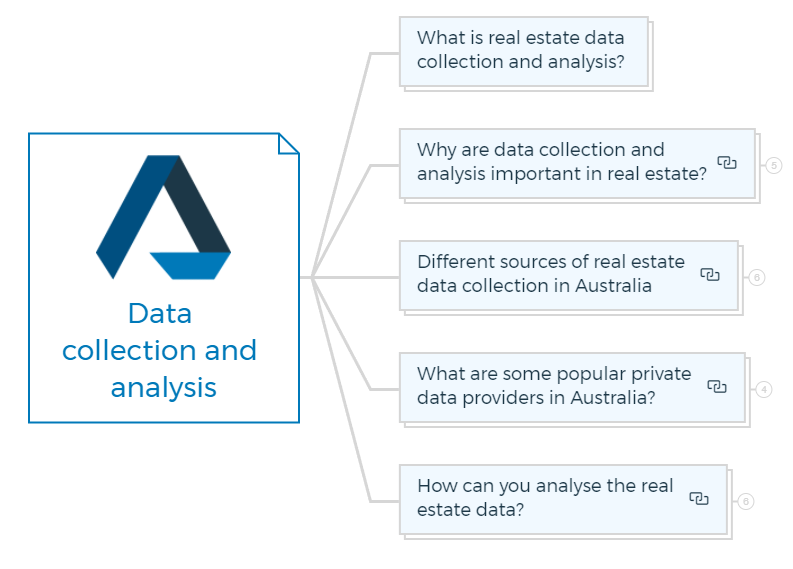
What is real estate data collection and analysis?
Real estate data collection and analysis involves acquiring and analysing market, property, and trend data.
It involves collecting, organising, and analysing data for decision-making. This area gives essential information to investors, developers, agents, and other real estate professionals, making it essential for the real estate industry.
You can collect real estate data from public documents, property listings, market reports, surveys, and online databases.
Data may include property features (size, location, amenities), transaction history, market prices, rental rates, occupancy rates, demographics, zoning regulations, and economic factors.
Learn More

Why are data collection and analysis important in real estate?
Real estate data gathering and analysis are important for various reasons:
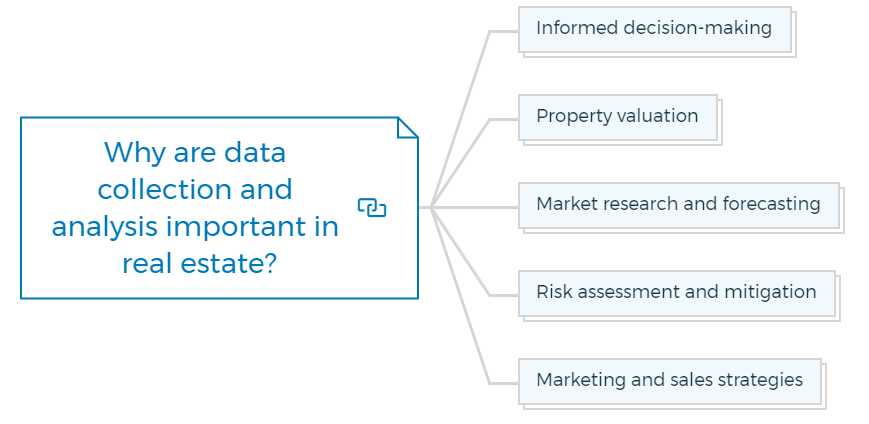
Informed decision-making
Real estate is a significant investment, and data analysis provides valuable insights to make informed decisions.
Buyers, sellers, investors, and property developers can find opportunities and risks by analysing market trends, property valuations, and rental rates.
Property valuation
Recent sales data, comparable properties, location, amenities, and market circumstances assist in determining a property’s fair market value. This guarantees fair property pricing and negotiations.
Learn More
Market research and forecasting
Data gathering and analysis help real estate professionals understand market trends, supply and demand, and upcoming prospects.
Analysts can predict market circumstances using historical data and predictive modelling, helping stakeholders plan investments and strategies.
Risk assessment and mitigation
Real estate investments involve economic swings, market volatility, and regulatory changes. Historical data and market indicators help identify risks.
Investors and developers can measure risk and mitigate it.
Marketing and sales strategies
Data analysis reveals buyer preferences, market segmentation, and demographics. This information helps real estate agents and developers focus on marketing, tailor property offerings, and find the correct audience.
It optimises sales methods, increasing customer engagement and conversion rates.
Learn More
Different sources of real estate data collection in Australia
In Australia, you can collect real estate data from various sources, including:
Public records and Government data
Government agencies in Australia provide valuable real estate data through public records. These records include property sales data, land titles, property ownership information, and planning and zoning regulations.
Key sources of public records and government data include:
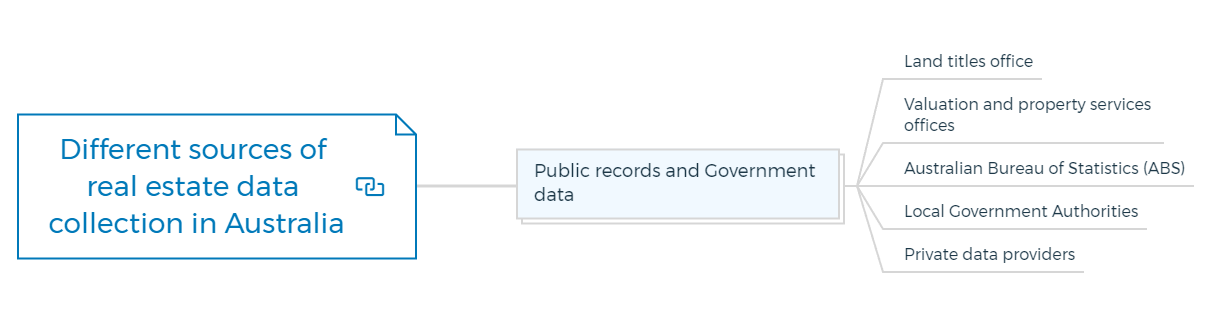
Land titles office
Each state and territory in Australia has a Land Titles Office that maintains records of property ownership, titles, and transactions.
Valuation and property services offices
These offices provide property valuation information and assessments for tax purposes.
Australian Bureau of Statistics (ABS)
The ABS collects and publishes data related to property prices, construction activity, rental rates, and housing finance.
Local Government Authorities
Local councils collect data on planning permits, land use regulations, and property developments within their jurisdictions.
Private data providers
Several private organisations and companies in Australia specialise in collecting and analysing real estate data.
These providers aggregate data from multiple sources and offer comprehensive datasets, market reports, and analytics. These private data providers often offer subscription-based services to industry professionals and investors.
You are missing out if you haven’t yet subscribed to our YouTube channel.

What are some popular private data providers in Australia?
There are various sources for collecting data. I have mentioned some popular sites in the video and the process to collect and analyse data from these sites. Apart from that, here are some of the more common data collection sources that can use -
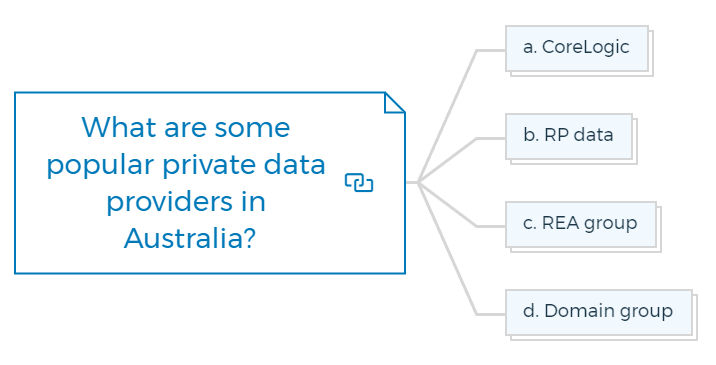
a. CoreLogic
CoreLogic is a leading provider of property information, analytics, and market insights. They offer a range of real estate data, including property valuations, sales data, rental information, and market reports.
b. RP data
RP Data, a subsidiary of CoreLogic, provides property and market information, including property valuations, sales history, property reports, and analytics.
c. REA group
REA Group operates realestate.com.au, one of Australia’s largest property listing websites. They offer market insights, property data, and reports.
d. Domain group
Domain Group is another major real estate platform in Australia. They provide property listings, market data, and research reports.
You can also use the paid services to save some of your time, and these paid services give easy access to data and provide you with ready-to-analyse data in Excel sheet formats.
How can you analyse the real estate data?
Property investors and developers can utilise Excel sheets to analyse real estate data in a structured and organised manner.
Here’s an example of how you can analyse real estate data using Excel:
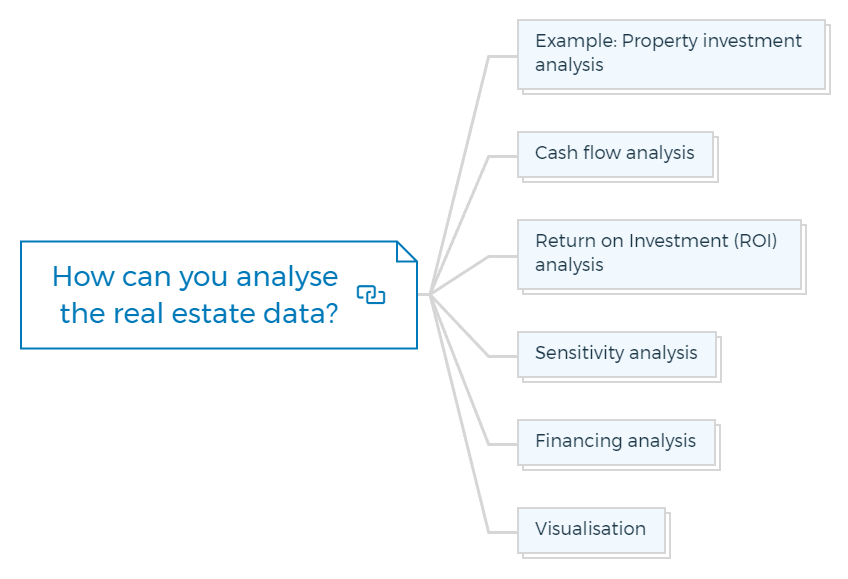
Example: Property investment analysis
Suppose an investor is considering purchasing a residential property for rental income. They have an Excel sheet containing relevant data for several potential investment properties.
The data includes the following columns:
- Property ID: Unique identifier for each property.
- Location: The neighbourhood or suburb where the property is located.
- Property Type: Indicates whether the property is a house, apartment, or townhouse.
- Purchase Price: The price at which the property can be acquired.
- Rental Income: The estimated monthly rental income the property can generate.
- Property Expenses: The monthly expenses associated with the property, such as property taxes, insurance, maintenance costs, and management fees.
- Vacancy Rate: The percentage of time the property is expected to remain vacant.
- Loan Details: Information regarding the financing, including the loan amount, interest rate, and loan term.
Learn More
Using this Excel sheet, the investor can perform various analyses:
Cash flow analysis
- Calculate the net cash flow for each property by subtracting property expenses from rental income.
- Use Excel formulas to subtract expenses from income and calculate the net cash flow on a monthly or annual basis.
- Summarise the net cash flow for each property and compare them to assess their profitability.
Return on Investment (ROI) analysis
- Calculate the ROI for each property to evaluate the potential returns.
- Use Excel formulas to divide the annual net cash flow by the initial investment (purchase price).
- Consider additional factors such as property appreciation and tax implications to get a comprehensive understanding of ROI.
Sensitivity analysis
- Perform sensitivity analysis to assess how changes in variables impact the investment’s performance.
- Create scenarios in Excel by adjusting variables such as rental income, expenses, and vacancy rates.
- Observe how these changes affect the net cash flow, ROI, and overall investment viability.
Financing analysis
- Utilise Excel functions to calculate monthly mortgage payments based on loan details.
- Determine the impact of different loan terms or interest rates on cash flow and ROI.
- Compare different financing options to identify the most favourable loan terms for the investment.
Visualisation
- Create charts and graphs in Excel to visually represent the data.
- Plot cash flows over time, compare property performance or display ROI for different properties.
- Visual representations can aid in understanding trends and making informed decisions.
Property investors and developers can assess the financial viability, profitability, and risks associated with potential investment properties by analysing the real estate data in the Excel sheet.
These analyses help them make informed decisions and optimise their investment strategies.
Check out the data I have attached in my property development course and try your hands at analysing it.
Test Your Knowledge

Real Estate Data Collection and Analysis Assignment
Objective:
This assignment is designed to enhance your understanding and application of real estate data collection and analysis concepts. You will engage in practical exercises that involve collecting, organizing, analyzing, and interpreting real estate data to make informed decisions regarding property investment and development.
Part 1: Data Collection Exercise
To Do:
- Choose a specific area in your region that interests you for real estate investment.
- Collect real estate data for this area using at least two different sources: one from public records or government data and another from a private data provider. Suggested sources include:
- Public Records: Land Titles Office, Valuation and Property Services Office, Australian Bureau of Statistics, or Local Government Authorities.
- Private Data Providers: CoreLogic, RP Data, REA Group, or Domain Group.
Research Questions:
- What type of property (e.g., residential, commercial) is predominantly sold in this area?
- What are the average selling prices of properties in the last year?
- How do rental rates compare across different property types in this area?
- Identify the demographic profile of the area based on available data.
Part 2: Data Analysis Exercise
To Do:
Using the data collected in Part 1, create an Excel sheet to organize your data with columns for Property ID, Location, Property Type, Purchase Price, Rental Income, Property Expenses, Vacancy Rate, and Loan Details.
Perform the following analyses using Excel:
- Cash Flow Analysis: Calculate the net cash flow for each property by subtracting property expenses from rental income.
- Return on Investment (ROI) Analysis: Calculate the ROI for each property to evaluate the potential returns.
- Sensitivity Analysis: Assess how changes in variables such as rental income, expenses, and vacancy rates impact the investment’s performance.
- Financing Analysis: Calculate monthly mortgage payments based on loan details and determine the impact of different loan terms or interest rates on cash flow and ROI.
Research Questions:
- Which property in your dataset offers the highest ROI?
- How does the vacancy rate affect the net cash flow and overall investment viability of properties in your dataset?
- Discuss the impact of different financing options on the profitability of a selected property.
Part 3: Visualisation and Interpretation
To Do:
- Create charts and graphs in Excel to visually represent your data analysis from Part 2.
- Visual representations should include cash flows over time, comparison of property performance, and ROI for different properties.
Research Questions:
- What trends can you identify from your visualizations regarding property investment in your selected area?
- How do property types or locations within your area compare in terms of investment potential based on your analysis?
Part 4: Final Report
Compile your findings, analyses, and visualizations into a comprehensive report. Your report should include:
- An introduction to the selected area and rationale for its choice.
- A methodology section describing how data was collected and analyzed.
- A results section presenting your findings from the cash flow, ROI, sensitivity, and financing analyses.
- Discussion of the visualizations and any trends or insights identified.
- Conclusion summarizing the potential investment opportunities and risks in your selected area based on your analysis.
Submission Guidelines:
- Submit your Excel file with all analyses and visualizations.
- Submit your final report as a PDF or Word document.
- Ensure all data sources are cited appropriately in your report.
This assignment will help you apply real estate data collection and analysis techniques in a practical context, enhancing your ability to make informed decisions in real estate investment and development.