What does stock on the market mean?


When investing in real estate, it is crucial to evaluate various metrics to make informed decisions. Stock on market is one such essential metric in property development.
This statistic helps property investors understand property supply and market dynamics.
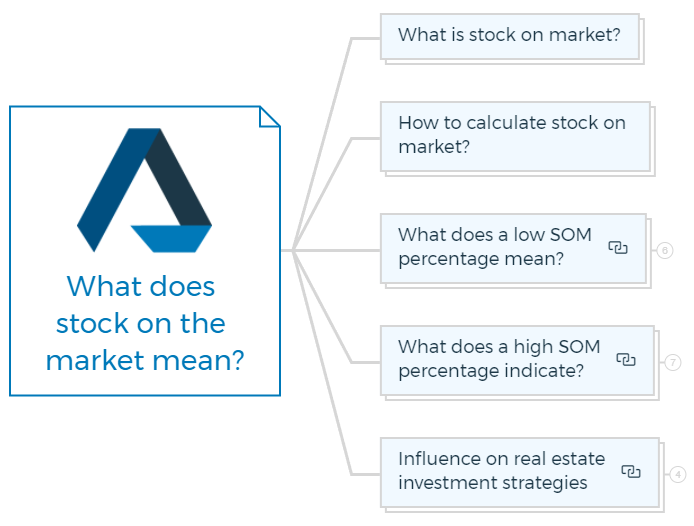
What is stock on market?
The amount of stock on the market refers to the number of properties available for sale or purchase in any specific market.
It represents the real estate market’s supply side, indicating the properties inventory that potential buyers or renters can choose from.
You are missing out if you haven’t yet subscribed to our YouTube channel.

How to calculate stock on market?
The percentile ratio is derived from the number of properties available for sale in the market versus the total number of properties in that area.
Stock on market SOM indicates many influencing factors that we should and must look up before jumping to any conclusions regarding property transactions.
Stock on market relies on the data of the number of available properties in a specific location. Listings, property portals, agents, and market reports can provide this data. The calculation is typically performed by aggregating the number of active property listings.
Learn More

For instance, the lower percentage of SOM signifies a low availability of property and a high demand in the market.
Both of them go hand in hand depending on the location and prices.
Moreover, the high SOM percentile evokes a sense of overflow, as the market has excess supply, but the number of potential buyers is less.
As a tip of advice, always look for that property where the SOM market value is between 1-3%.
If the SOM is greater than 3%, this means too much demand, while if it is less than 1%, you need to have a closer look at that suburb. Look closely into the matter and then make your decision.
What does a low SOM percentage mean?
The market has a low supply of available properties when SOM is low. This suggests there are fewer properties for sale or rent than total properties on the market. Low SOM usually shows:
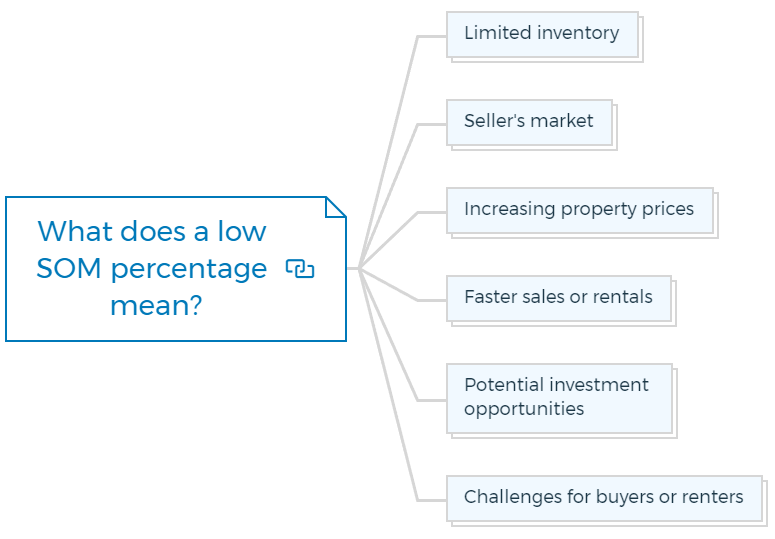
Limited inventory
Low SOM signifies limited property inventory. This can occur for various reasons, such as high demand, limited new constructions, or property listing slowdowns. Buyers and renters may have fewer options.
Seller’s market
A low SOM indicates a seller’s market when buyers and renters outnumber properties. Sellers have more negotiation leverage in a seller’s market because they may get numerous bids or sell quickly.
Increasing property prices
Due to buyer rivalry, restricted property availability can raise prices. Buyers may pay more for fewer properties, raising prices.
Learn More
Faster sales or rentals
Limited availability and great demand might shorten property listings. Sellers and landlords may have faster transactions and shorter listing-to-closing times.
Potential investment opportunities
Sellers and property investors may benefit from low SOM. Sellers may receive several offers or higher pricing due to limited supply. Demand for rentals may present opportunities for property investors.
Challenges for buyers or renters
Low SOM might provide problems for purchasers and tenants. They may have trouble obtaining properties in their desired areas or budgets due to limited supply. Buyers may need to act fast and make competing offers to get a property.
What does a high SOM percentage indicate?
When SOM (Stock On Market) is high, the market has a lot of properties. This means there are more properties for sale or rent than the total number of properties in the market. High SOM usually means:
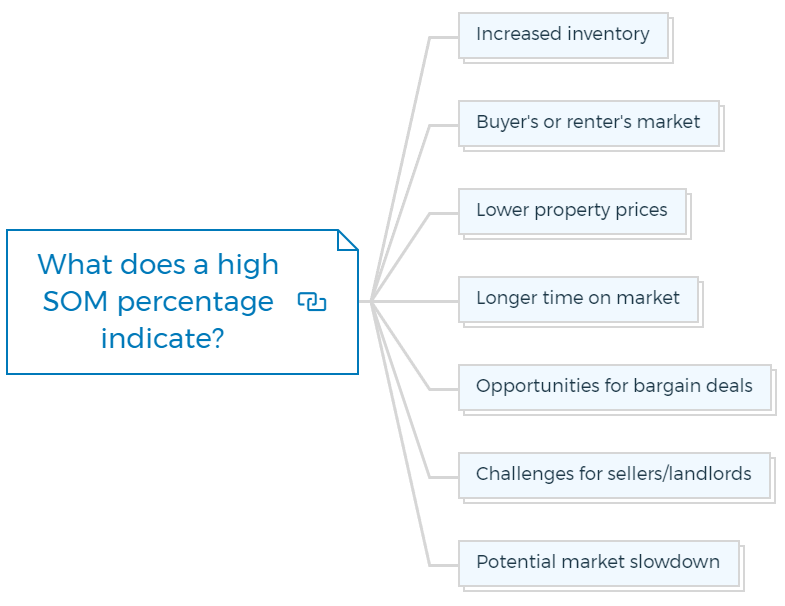
Increased inventory
High SOM signifies more properties on the market. New construction, demand slowdown, or more property listings might cause this. Buyers and renters have more options.
Buyer’s or renter’s market
A high SOM percentage frequently indicates a buyer’s or renter’s market when property supply exceeds demand. In a competitive market, buyers and renters have more options and negotiation power.
Lower property prices
Property prices may fall if supply exceeds demand. To entice buyers or tenants, sellers may need to lower their prices.
Longer time on market
With a high percentage of SOM, properties tend to stay on the market for longer periods. Increased supply and seller competition can extend selling or rental durations.
Sellers and landlords may have a longer average listing-to-closing time.
Opportunities for bargain deals
Buyers and renters can negotiate better prices with a high SOM. They may have more negotiating power, concessions, and rental arrangements with more properties.
Challenges for sellers/landlords
Sellers and landlords may struggle with high SOM. Increased competition may force them to modify pricing, make upgrades to stand out, or be patient as properties take longer to sell or rent.
Potential market slowdown
High SOM can potentially signal a market decline. It may indicate low property demand or oversupply. You should observe the market conditions to understand the high SOM and predict future trends.
Influence on real estate investment strategies
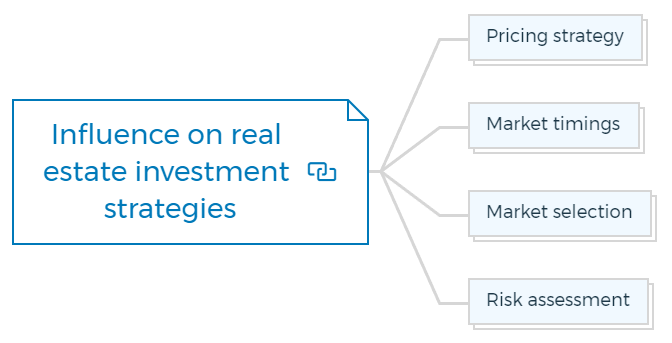
Pricing strategy
Property stock helps real estate investors set prices. Competitive pricing attracts buyers and renters in a high stock market.
Due to increasing demand, pricing intentionally higher in a depressed stock market may maximise returns.
Market timings
Understanding property stock on market can help investors discover favourable market situations for buying or selling properties.
A low stock level indicates a seller’s market for property sales, whereas a significant stock level gives buyers negotiation strength.
Market selection
Investors might find supply-demand mismatches by analysing property stock. Low stock and high demand can boost capital appreciation and rental revenue.
Risk assessment
Property stock can assist investors in estimating market risk. High stock levels may indicate protracted selling periods, increasing competition, and price declines.
Low stock may indicate few possibilities and difficulty finding suitable properties.
Investors use stock on market to understand supply and demand and market conditions. This statistic helps investors choose markets, prices, and timing. You should regularly monitor the stock on market in different suburbs to adapt investment plans to market trends and dynamics.
Test Your Knowledge

Part 1: Understanding Concepts
Questions:
- Define “stock on the market” in your own words and explain why it is a crucial metric for real estate investors.
- How is the stock on the market calculated? Describe the process and mathematical formula, if any.
- Discuss the implications of a low stock on market (SOM) percentage and its impact on buyers, sellers, property prices, and investment opportunities.
- Explain what a high SOM percentage indicates about the real estate market and its effects on market participants.
Part 2: Data Collection and Analysis
To Do:
- Choose a specific suburb or city area where you will study the real estate market.
- Collect data on the current stock on the market for your chosen area. You may use real estate listings, property portals, and market reports as sources.
- Calculate the SOM percentage for your chosen area. Provide the numbers of properties available for sale, the total number of properties, and the SOM percentage.
Part 3: Research Questions
Research Questions:
- Investigate how the current SOM percentage in your chosen area compares to the same time last year. Discuss possible reasons for any changes observed.
- Identify trends in the real estate market based on SOM data over the past five years in your selected area. Consider factors such as new constructions, economic changes, and population growth.
Part 4: Application and Strategy
To Do:
- Based on your analysis in Parts 2 and 3, assess whether the current market conditions favour buyers or sellers. Justify your answer with data and trends.
- Propose a pricing strategy for a property investor looking to buy or sell in your chosen area. Consider current SOM data and predicted market trends.
- Suggest at least two investment strategies for real estate investors based on the current stock on the market conditions. Discuss the risk and potential return.
Part 5: Discussion and Conclusion
Questions:
- Reflect on how SOM influences real estate investment decisions and market timing.
- Considering the SOM’s influence on pricing strategy and market selection, discuss how an investor could use SOM data to minimize risk and maximize returns.
- How might a significant shift in SOM percentages impact your investment strategies and recommendations for the real estate market in your chosen area?